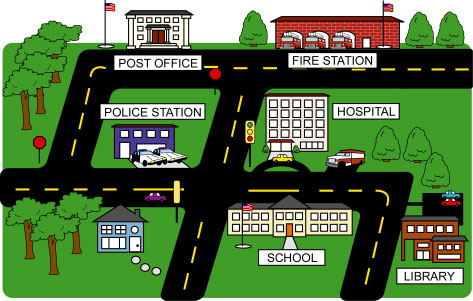
In part 1, we discussed all of the stakeholders that exist in our model and the roles which each stakeholder plays. This part zooms out from the framework and looks at the world as the sum of the components in a particular locality – the neighborhood, the city, and the state, to name a few examples. A good way to represent an individual locality is to draw a border around a particular area that we’d like to look at. Once the border is drawn, it is much easier to break each stakeholder down and then add everything back up to get all of the in’s and out’s of everything that occurs within that border.
Let’s focus first on the most tangible of the localities, the neighborhood. The neighborhood is typically comprised of individuals and organizations that provide some form of employment for a subset of the population. Most adult individuals have a form of income, be it a blue collar job or a white collar job, but irrespective of that, most have some form of income.
In order to produce that income, they find an organization willing to exchange cash for their time. One big variable across individuals is value of an individual’s time, since the amount of income depends on the industry that the organization is involved in as well as the role of the individual at the organization. In the same way that income varies across individuals, it also varies across organizations. Lucrative organizations have more freedom in providing compensation for individuals time and subsequently are able to pay more than organizations that operate with tighter profit margins.
As was alluded in Part 1, organizations can have an impact on the localities in which they exist – in the form of providing income to individuals that live in the same locality or by providing income for other organizations, e.g. when furniture maker pays a lumber company to make furniture, the lumber company benefits from the furniture maker’s existence, allowing the lumber company to pay for its own obligations, and so on. In a closed locality, there is no cash into or out of the locality… these systems are basically non-existent. What is more common is the open locality model, whereby individuals are free to work inside of and outside of their locality, thus decentralizing the form of income for the individual.
It is easy to tell the difference between affluent neighborhoods and poor neighborhoods. Affluent neighborhoods have a high concentration of affluent individuals, some who have gained their wealth through inheritance and others by earned/saved income. Ultimately, the source is irrelevant to this analysis. Affluent neighborhoods generally have a larger tax base, nicer schools, better maintained infrastructure and the list goes on. Poor neighborhoods are the polar opposite of affluent neighborhoods on the socioeconomic spectrum and typically contain a far denser population of lower income individuals. Typically these neighborhood budgets are strained in being able to provide comparable services to that of affluent neighborhoods.
So all of this begs the following questions: What makes a locality (or neighborhood) improve or decline (the first derivative: the rate of change)? What are the factors that truly impact the trajectory of a given neighborhood (the second derivative: the acceleration or deceleration of growth)? Part 3 will attempt to answer these questions.

